Download Libre Hardware Monitor for Windows
Track CPU and GPU temperatures, fan speeds, voltages, and clock speeds in real time. Free, open-source, and portable — no install required.
What Is Libre Hardware Monitor?
A free, open-source system monitoring tool that gives you real-time visibility into your PC hardware – temperatures, fan speeds, voltages, and more.
Hardware Monitoring Without the Guesswork
Libre Hardware Monitor is a free, open-source application that reads hardware sensors built into your CPU, GPU, motherboard, storage drives, and network adapters. It displays live temperature readings, fan RPMs, voltage rails, clock speeds, and load percentages in a clean tree-view interface. If you have ever wondered whether your CPU is running hot during a game or your NVMe drive is throttling under heavy writes, this tool gives you those answers in real time.
The project started as a fork of Open Hardware Monitor after that application stopped receiving updates around 2020. A community of over 260 contributors on GitHub picked up the codebase and expanded it significantly. Today, Libre Hardware Monitor supports recent hardware that Open Hardware Monitor never will – including AMD Ryzen 9000 series processors, Intel 14th Gen and Arrow Lake CPUs, and the latest NVIDIA and AMD graphics cards.
Who Should Use It
PC builders and overclockers rely on Libre Hardware Monitor to verify their cooling solutions and voltage settings are within safe ranges. System administrators use the built-in web server (port 8085) to check temperatures remotely from a phone or another workstation on the same network. Developers integrate it into their own C# applications through the LibreHardwareMonitorLib NuGet package. Home automation enthusiasts connect it to Home Assistant for automated alerts when a sensor exceeds a threshold.
Unlike paid alternatives such as AIDA64 ($39.95), Libre Hardware Monitor costs nothing. Unlike closed-source freeware like HWiNFO64, you can inspect every line of code on GitHub. The entire application is licensed under the Mozilla Public License 2.0, so you are free to use it, modify it, and distribute it.
Portable and Lightweight
There is no installer. You download a 1.8 MB ZIP file, extract it to any folder, and run the executable. It leaves no registry entries (unless you enable auto-start), installs no background services, and uses minimal system resources. When you are done, just delete the folder. This makes Libre Hardware Monitor a go-to diagnostic tool for USB flash drives and portable toolkits – the kind of utility you keep alongside everything else in your troubleshooting kit.
The application runs on Windows 7 through Windows 11, requires .NET Framework 4.7.2, and works on both 32-bit and 64-bit systems. You can also install it quickly through the command line with winget install LibreHardwareMonitor on Windows 10 and 11.
Key Features
Libre Hardware Monitor reads data directly from hardware chips and controllers, giving you accurate, real-time insight into every component in your PC.
Real-Time Temperature Monitoring
Tracks live temperatures for CPUs, GPUs, motherboards, and NVMe drives. Supports the latest Intel Arrow Lake, Meteor Lake, and AMD Ryzen 9000 processors out of the box. Min/max/current values update every second so you can spot thermal spikes the moment they happen.
Fan Speed Monitoring and Control
Displays RPM readings for CPU coolers, case fans, GPU fans, and AIO pumps. Also exposes a fan controller interface so third-party tools like FanControl can set custom fan curves through the same sensor data layer Libre Hardware Monitor provides.
Voltage Rail Tracking
Reads CPU core, DRAM, GPU, and motherboard voltage rails from VRM controllers. Useful for overclockers who need to verify their BIOS voltage settings match what hardware actually reports.
CPU and GPU Load and Clocks
Shows per-core clock frequencies, total utilization, and power draw for both processors and graphics cards. Covers NVIDIA, AMD, and Intel Arc GPUs with memory clock, shader clock, and VRAM usage readings.
S.M.A.R.T. Storage Health
Pulls S.M.A.R.T. data from HDDs, SATA SSDs, and NVMe drives. Reports drive temperature, total bytes written, remaining life percentage, and read/write throughput so you can catch a failing drive early.
Built-In Web Server
Starts a lightweight HTTP server on port 8085. Open it from any phone, tablet, or second PC on the same network to check sensor readings remotely. Works with Home Assistant for smart-home dashboards.
Network Interface Monitoring
Tracks per-adapter throughput for Ethernet and Wi-Fi. Shows real-time upload and download speeds plus total data transferred since the app launched, broken down by each network interface.
Battery Health Reporting
On laptops, displays charge level, charge/discharge rate, designed vs. current capacity, and estimated remaining time. Helps you track battery degradation over months of use without installing a separate tool.
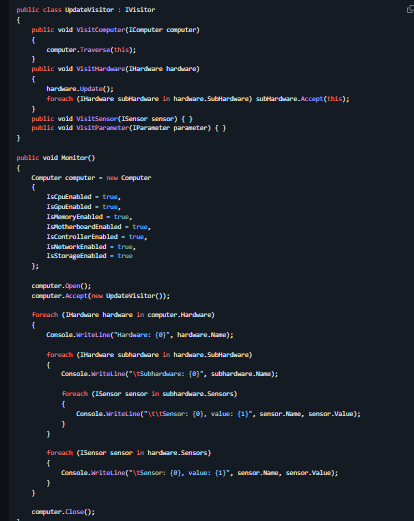
WMI Provider and NuGet Library
Exposes all sensor data via the WMI namespace root\LibreHardwareMonitor, so Rainmeter skins and PowerShell scripts can read it directly. Developers can also pull in LibreHardwareMonitorLib via NuGet for .NET 8, 9, or 10 projects.
Sensor Logging and Graphing
Logs every reading to CSV at a configurable interval for long-term analysis. The built-in plot view lets you graph any sensor over time right inside the app, no spreadsheet needed.
Libre Hardware Monitor is fully portable and open source under the MPL-2.0 license. Download it now and start monitoring your hardware in seconds.
System Requirements
Libre Hardware Monitor runs on most Windows PCs with minimal resources. Here is what you need to get full sensor access.
| Component | Minimum | Recommended |
|---|---|---|
| Operating System | Windows 7 SP1 (32-bit or 64-bit) Requires .NET Framework 4.7.2 | Windows 10 or 11 (64-bit) .NET 4.7.2+ pre-installed on Win 10 1803+ |
| Processor (CPU) | Any Intel or AMD x86/x64 processor Single-core 1 GHz or faster | Modern multi-core Intel or AMD CPU Dual-core 2 GHz+ for smooth graphing |
| RAM | 512 MB App uses ~40-60 MB at idle | 2 GB or more Extra headroom when logging many sensors |
| Disk Space | 50 MB Portable app, no installer | 200 MB Includes space for CSV log files over time |
| Display | 1024 x 768 resolution | 1920 x 1080 or higher Tree view and graphs benefit from wider screens |
| GPU | Not required to run Integrated graphics is fine | Any NVIDIA, AMD, or Intel GPU Needed only for GPU temperature and load monitoring |
| Runtime | .NET Framework 4.7.2 Download from Microsoft if not installed | .NET Framework 4.8+ Ships with Windows 10 May 2019 Update and later |
| Permissions | Standard user (limited sensors) Some sensors hidden without admin access | Run as Administrator Full access to CPU, GPU, motherboard, and storage sensors |
Libre Hardware Monitor v0.9.4 is a portable application – no installation required. Extract and run directly from any folder.
Download Libre Hardware Monitor
Grab the latest release directly from the official GitHub repository. No installer needed – just extract and run.
Built on .NET Framework 4.7.2, which comes pre-installed on Windows 10 and 11. This is the version most users should pick – no extra runtime downloads required. Compatible with Windows 7 through Windows 11 (both 32-bit and 64-bit).
Download Libre Hardware Monitor • 6.33 MB • WindowsBuilt on .NET 10 for improved performance and lower memory usage. Requires the .NET 10 runtime, which you can install from Microsoft if it is not already on your system. Best for developers or users who already have .NET 10 installed.
Download .NET 10 Build • 8.49 MB • Windowswinget install LibreHardwareMonitor
Libre Hardware Monitor is portable software. Extract the ZIP to any folder and run LibreHardwareMonitor.exe as Administrator for full sensor access.
Need help setting up? Check the Getting Started guide.
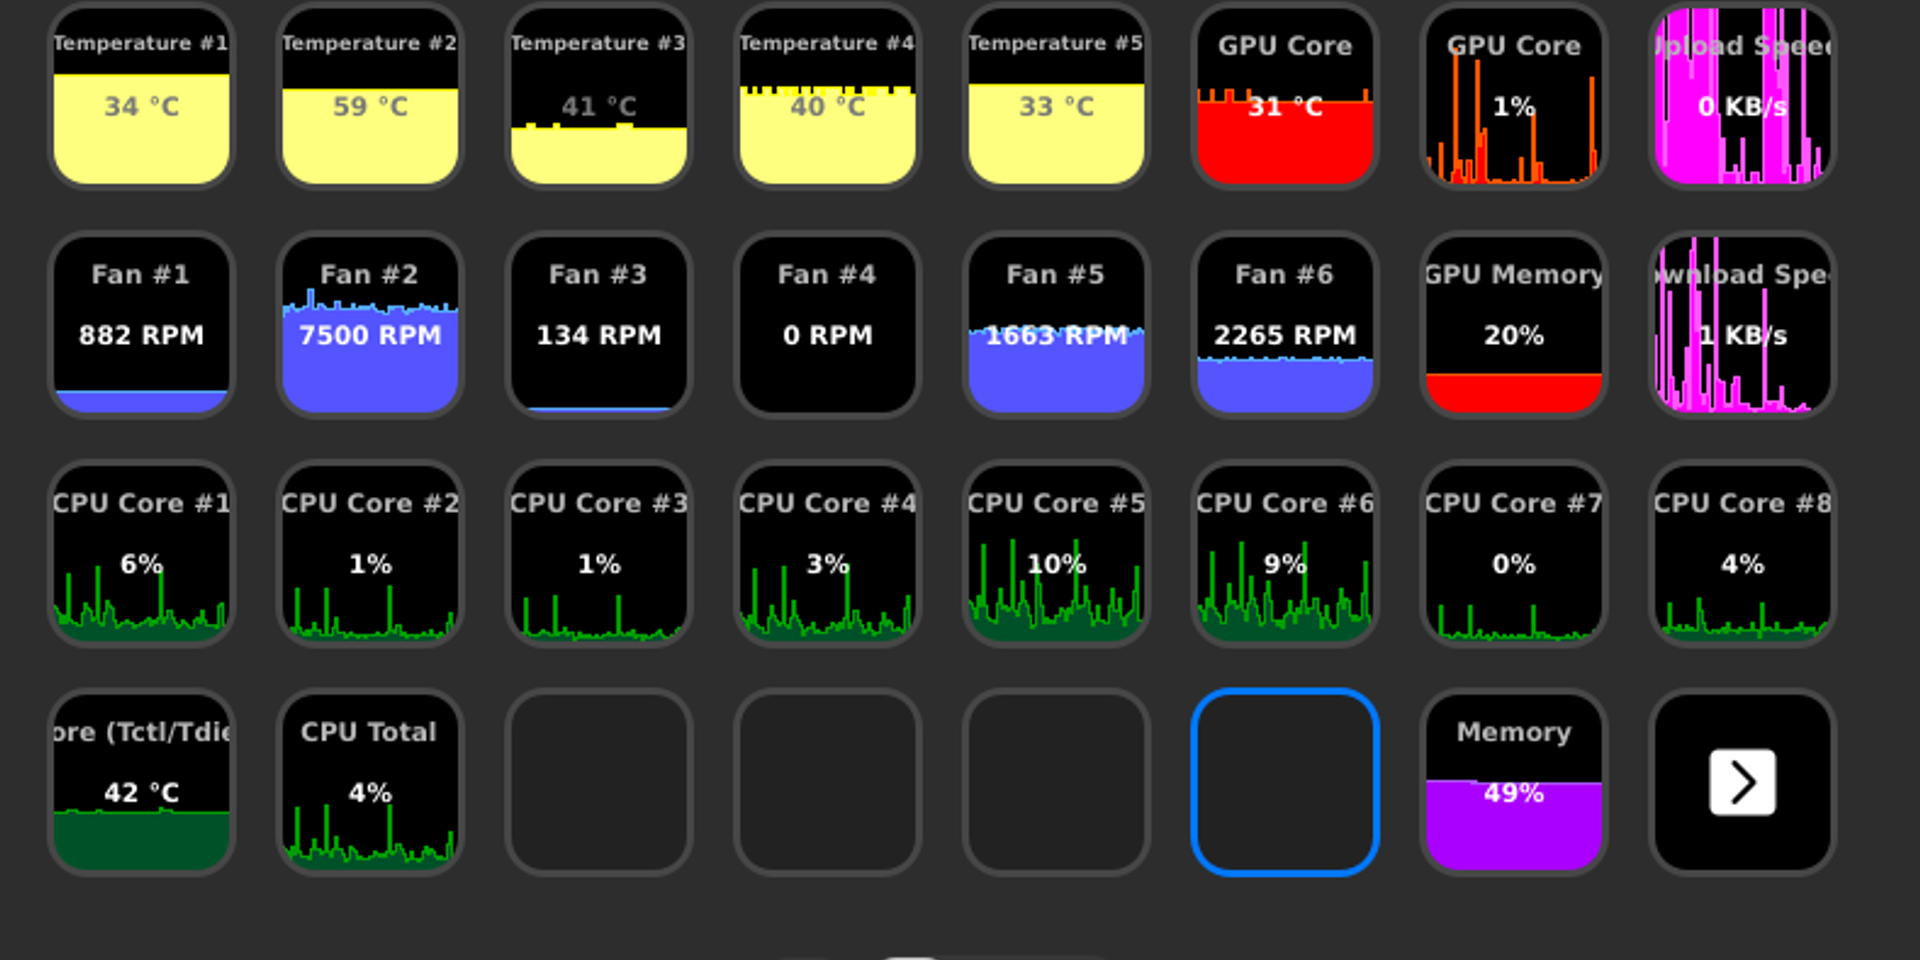
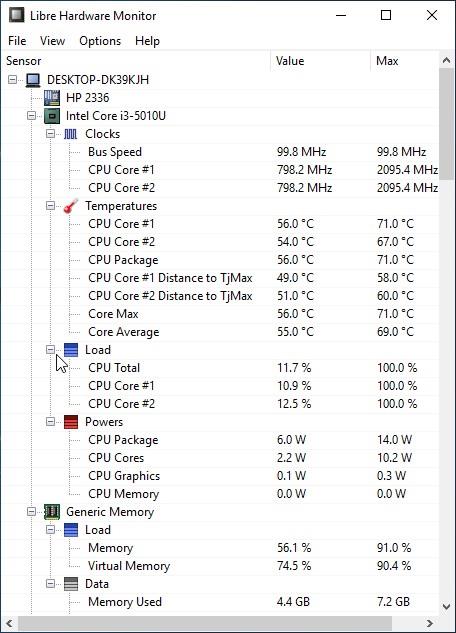
Screenshots
See Libre Hardware Monitor in action. Click any image to view it full-size.


Getting Started with Libre Hardware Monitor
From download to full hardware monitoring in under five minutes. Here is everything you need to know to start tracking your PC temperatures, fan speeds, and voltages.
Downloading Libre Hardware Monitor
Head to our download section above and grab the latest release of Libre Hardware Monitor. The current version is v0.9.4, released November 24, 2024. The download is a single ZIP archive named LibreHardwareMonitor-net472.zip, weighing in at just 1.8 MB – small enough to download in seconds on any connection.
Libre Hardware Monitor is a portable application, which means there is no traditional installer (.exe or .msi setup wizard). You download a ZIP file, extract it, and run the program directly. This makes it a good pick for beginners who want a clean, no-commitment approach – the app does not write to your Windows registry, does not install background services, and can be moved between PCs on a USB drive.
There is only one version of the ZIP file, and it works on both 32-bit and 64-bit systems running Windows 7 through Windows 11. You do not need to pick between architectures or platform editions. The program requires .NET Framework 4.7.2, which comes preinstalled on Windows 10 version 1803 and newer. If you are on an older Windows 7 or 8 machine, you may need to install .NET Framework 4.7.2 separately from Microsoft before running Libre Hardware Monitor.
If you prefer package managers, you can also install through WinGet:
Extracting and Running for the First Time
Since Libre Hardware Monitor is portable, the “installation” is just extracting the ZIP contents to a folder. Here is the full walkthrough:
- Locate the downloaded ZIP file (usually in your Downloads folder). Right-click it and select Extract All… in Windows Explorer, or use a tool like 7-Zip if you prefer.
- Choose a permanent location for the extracted files. A good spot is
C:\Tools\LibreHardwareMonitor\orC:\Program Files\LibreHardwareMonitor\. Avoid extracting to your Desktop or Downloads folder since you might accidentally delete it later. - Open the extracted folder. You will see several files including
LibreHardwareMonitor.exe,LibreHardwareMonitorLib.dll, and a few supporting files. - Right-click
LibreHardwareMonitor.exeand select Run as administrator. Administrator privileges are needed because the program uses a kernel driver (LibreHardwareMonitor.sys) to read low-level hardware sensor data from your CPU, GPU, and motherboard chipset.
LibreHardwareMonitor.sys driver file. This is a false positive caused by the WinRing0 kernel driver that reads hardware registers. The same driver is used by MSI Afterburner, FanControl, and OpenRGB. Add an exclusion in your antivirus for the Libre Hardware Monitor folder to prevent the file from being quarantined.On the first launch, the main window appears with a tree view listing every piece of hardware detected in your system – motherboard, CPU, GPU, RAM, storage drives, and network adapters. Each hardware node expands to show its sensors: temperatures, clock speeds, voltages, fan speeds, and load percentages. Values update in real time every second.
No registration is needed, no account creation, no license key. The program is fully functional from the very first launch.
Initial Setup and Configuration
Libre Hardware Monitor works well out of the box, but a few settings are worth adjusting right away. All configuration options are in the Options menu at the top of the window.
Settings you should enable immediately:
- Options > Run On Windows Startup – Tick this if you want Libre Hardware Monitor to launch automatically when you boot your PC. It adds a shortcut to your Windows startup folder (not a registry entry).
- Options > Start Minimized – Pair this with the startup option so the program opens straight to the system tray without showing the main window every time you log in.
- Options > Minimize On Close – When enabled, clicking the X button sends the program to the system tray instead of closing it. Useful if you want it running in the background all day.
Customize your system tray display:
One of the best features is showing live sensor values directly in your Windows taskbar tray. Go to View > Show Gadget to enable a floating desktop widget, or right-click any sensor in the tree view and choose Show in Tray. For example, you can pin your CPU Package temperature so it displays as a number (like “58”) in the system tray at all times.
Temperature units: By default, temperatures are shown in Celsius. To switch to Fahrenheit, go to Options > Temperature Unit and select Fahrenheit.
Theme selection: Since version 0.9.4, Libre Hardware Monitor includes a dark mode. Go to Options > Theme and switch between Light and Dark based on your preference.
Monitoring Your Hardware – A Practical Walkthrough
Here is how to use Libre Hardware Monitor for the most common task: checking if your PC is overheating under load.
Step 1: Expand your CPU node. In the tree view, click the arrow next to your processor name (e.g., “AMD Ryzen 7 5800X” or “Intel Core i7-13700K”). You will see sub-categories: Clocks, Temperatures, Load, Power, and Voltage. Expand Temperatures to see individual core temps and the CPU Package temperature – this is the number you care about most.
Step 2: Check your GPU. Expand the GPU node (listed as “NVIDIA GeForce RTX 4070” or similar). Look at GPU Core temperature, GPU Memory usage, and Fan Speed in RPM. If GPU temperatures stay below 85°C under gaming load, your cooling is working fine.
Step 3: Start a stress test or game. Open a demanding application – a game, video render, or stress test tool like Prime95 or Cinebench. Watch the sensor values in Libre Hardware Monitor update in real time. The Min and Max columns track the lowest and highest values recorded during your session, which helps you identify peak temperatures.
Step 4: Log your readings. For long-term tracking, go to Options > Log Sensors to enable CSV logging. Libre Hardware Monitor writes a timestamped CSV file to the application folder. You can open this file in Excel or Google Sheets to chart temperature trends over hours or days.
Step 5: Monitor remotely. If you want to check temperatures from your phone or another computer, go to Options > Remote Web Server and enable it. The default port is 8085. Open a browser on any device connected to the same network and go to http://YOUR-PC-IP:8085. You will see a web-based version of the sensor tree.
Here are some useful shortcuts and menu actions:
| Action | Where to Find It |
|---|---|
| Reset Min/Max values | Right-click any sensor > Reset Min/Max |
| Show sensor in tray | Right-click sensor > Show in Tray |
| Plot sensor graph | View > Plot (opens a graph window) |
| Enable/disable hardware | Options > select/deselect hardware categories |
| Export sensor log | Options > Log Sensors (saves CSV to app folder) |
| Remote monitoring | Options > Remote Web Server (port 8085) |
Tips, Tricks, and Best Practices
Close conflicting monitoring tools. Running Libre Hardware Monitor alongside HWiNFO, MSI Afterburner, or AIDA64 can cause sensor conflicts. Some sensors only allow one application to read them at a time, so you may see missing readings or zeros. Pick one monitoring tool and close the others.
Missing sensor readings? If a sensor shows 0 or is absent from the tree, try running the application as Administrator (right-click > Run as administrator). Without admin rights, the kernel driver cannot access certain chipset registers, especially for motherboard voltage rails and fan headers.
Integrate with Rainmeter. Libre Hardware Monitor exposes all sensor data through a WMI provider (namespace root\LibreHardwareMonitor). Rainmeter skins can query this WMI data to display CPU temp, GPU load, or fan speed directly on your desktop. Just make sure Libre Hardware Monitor is running in the background.
Home Assistant integration. If you run a smart home setup, Libre Hardware Monitor has an official Home Assistant integration. Enable the Remote Web Server in Options, then add the integration in Home Assistant using your PC’s local IP address and port 8085.
Watch out for anti-cheat. Some games with kernel-level anti-cheat (EasyAntiCheat, Vanguard) may conflict with the WinRing0 driver. If a game refuses to launch, close Libre Hardware Monitor and try again. You can always restart LHM after your gaming session ends.
Stay updated. Libre Hardware Monitor does not have an auto-update feature, so check the download section periodically for new releases. Major versions add support for new CPUs, GPUs, and motherboard chipsets. The project also publishes nightly builds on GitHub for users who want the latest hardware support before an official release.
Where to find help: The main support channel is the GitHub Issues page, where you can search for your hardware or report bugs. The project has 262+ contributors and an active community. Reddit discussions on r/buildapc and r/overclocking frequently mention Libre Hardware Monitor as a recommended tool.
Ready to start monitoring? Download Libre Hardware Monitor v0.9.4 and have full sensor visibility in under five minutes.
Frequently Asked Questions
Answers to the most common questions about downloading, installing, and using Libre Hardware Monitor on Windows.
Is Libre Hardware Monitor safe to download and use?
Yes, Libre Hardware Monitor is safe. It is a 100% open-source project hosted on GitHub with over 7,900 stars, 895 forks, and 262 contributors who review every code change publicly. The source code is available for anyone to audit under the Mozilla Public License 2.0.
The application itself contains no adware, spyware, telemetry, or bundled toolbars. However, it does use the WinRing0 kernel driver (LibreHardwareMonitor.sys) to access low-level hardware sensors. This driver has known security vulnerabilities (CVE-2020-14979) that allow local privilege escalation – meaning another program on your PC could theoretically exploit it. This is why antivirus software flags it, not because Libre Hardware Monitor is malicious. The same WinRing0 driver is used by MSI Afterburner, FanControl, OpenRGB, and dozens of other popular hardware tools.
- Always download from the official GitHub Releases page or from our download section
- Avoid third-party download sites that may bundle unwanted software with the installer
- Run the program as Administrator only when you need full sensor access
- Close the application when you are done monitoring – the WinRing0 driver unloads when the program exits
Pro tip: If you are concerned about the WinRing0 vulnerability, run Libre Hardware Monitor only during monitoring sessions instead of leaving it running at startup. The risk is low for home users, but worth noting if you run sensitive workloads.
For full details on what the program monitors, see our features overview.
Why does Windows Defender or my antivirus flag Libre Hardware Monitor?
Antivirus programs flag Libre Hardware Monitor because of its WinRing0 kernel driver, not because the software contains malware. Microsoft Defender specifically detects it as “HackTool:Win32/Winring0” or “VulnerableDriver:WinNT/Winring0” starting in late 2024.
The WinRing0 driver provides direct hardware access through I/O port and MSR (Model-Specific Register) operations at the kernel level. It has a documented vulnerability (CVE-2020-14979) where its insecure IOCTLs could be exploited by other malicious software already on your system to escalate privileges. Microsoft began flagging all programs that use this driver – including MSI Afterburner, FanControl, OpenRGB, CapFrameX, and Razer Synapse – not just Libre Hardware Monitor. Neowin, The Verge, and Gamers Nexus have all covered this issue in depth.
- Open Windows Security and go to Virus & threat protection > Protection history
- Find the flagged item and click Allow on device if you trust the source
- Alternatively, go to Settings > Exclusions > Add an exclusion and add the folder where you extracted Libre Hardware Monitor
- For Bitdefender, Norton, or Avast, add LibreHardwareMonitor.exe and LibreHardwareMonitor.sys to the exceptions list
Pro tip: After a Windows Defender definition update, the exclusion may reset. Check your exclusions list after major Defender updates if the app suddenly stops working.
For step-by-step setup help, visit our Getting Started guide.
Where is the official safe download for Libre Hardware Monitor?
The only official source for Libre Hardware Monitor is the GitHub Releases page at github.com/LibreHardwareMonitor/LibreHardwareMonitor/releases. The latest stable release is v0.9.4, published on November 24, 2024, with over 2.5 million downloads.
The file you want is LibreHardwareMonitor-net472.zip, which is approximately 1.8 MB. There is no standalone .exe installer – the program is distributed as a portable ZIP archive. You extract it and run LibreHardwareMonitor.exe directly. If you see an .exe installer or .msi file claiming to be Libre Hardware Monitor on a third-party site, do not download it. The project has never distributed an installer. You can also install via the Windows Package Manager by running winget install LibreHardwareMonitor from a terminal.
- GitHub Releases – the primary official source with checksums and release notes
- WinGet (Windows Package Manager) – installs the official build via command line
- Our download section links directly to the official GitHub release
Pro tip: Bookmark the GitHub Releases page directly. Sites like Softonic, FileHorse, or CNET may wrap the download in their own installer that bundles adware.
Check our system requirements before downloading to confirm your system is compatible.
Does Libre Hardware Monitor work on Windows 11?
Yes, Libre Hardware Monitor v0.9.4 works on Windows 11 including the latest 24H2 update. It supports both 64-bit and 32-bit editions, though nearly all Windows 11 installations are 64-bit.
The application runs on .NET Framework 4.7.2, which comes pre-installed on Windows 11. You do not need to install any additional runtime. Sensor support on Windows 11 includes Intel 12th through 14th Gen (Alder Lake, Raptor Lake, Meteor Lake), Arrow Lake, Lunar Lake, AMD Ryzen 5000/7000/9000 series, and NVIDIA RTX 30/40/50 series GPUs. Windows 11’s Virtualization-Based Security (VBS) and Memory Integrity features do not block Libre Hardware Monitor, though you may see the WinRing0 driver flagged by Defender as described in the safety question above.
- Download the net472 ZIP from the official GitHub or our download section
- Extract to any folder and right-click LibreHardwareMonitor.exe > Run as administrator
- If Windows SmartScreen appears, click More info > Run anyway
- Add an antivirus exclusion for the folder if Defender quarantines the driver
Pro tip: On Windows 11 ARM devices (like Surface Pro X), Libre Hardware Monitor runs through x86 emulation but some sensor readings may be limited. Native ARM support is being tracked on GitHub.
See the full list of supported hardware in our features section.
What are the minimum system requirements for Libre Hardware Monitor?
Libre Hardware Monitor has very low system requirements. It runs on any Windows PC from Windows 7 through Windows 11, needs about 50 MB of disk space, and uses roughly 20-40 MB of RAM during operation.
The only hard dependency is .NET Framework 4.7.2, which ships with Windows 10 version 1803 and later. On Windows 7 or 8.1, you may need to install it manually from Microsoft’s download center. The CPU requirement is effectively zero – any Intel or AMD processor made in the last 15 years will work. There is no GPU requirement for the application itself, though you obviously need a GPU installed if you want to read GPU sensor data. Administrator privileges are recommended for full sensor access but not strictly required for basic readings.
- OS: Windows 7 SP1, 8, 8.1, 10, or 11 (32-bit or 64-bit)
- RAM: 512 MB minimum, 2 GB recommended
- Disk: 50 MB minimum (200 MB recommended if you enable sensor logging)
- Runtime: .NET Framework 4.7.2 or later
- Privileges: Administrator recommended for full hardware access
Pro tip: If you plan to run the built-in web server for remote monitoring, make sure port 8085 is available and that your firewall allows incoming connections on that port.
View the detailed specs in our system requirements table.
Does Libre Hardware Monitor work on macOS or Linux?
No, Libre Hardware Monitor is Windows-only. It is built with C# on the .NET Framework and relies on Windows-specific kernel drivers (WinRing0) and WMI interfaces to read hardware sensors. There are no macOS or Linux versions, and running it through Wine or Mono is not supported.
For macOS users, the closest alternatives are iStat Menus (paid, around $11.99) and Intel Power Gadget (free, Intel CPUs only). On Linux, the standard tool is lm-sensors combined with the sensors command, which reads CPU and motherboard temperatures natively. For GPU monitoring on Linux, NVIDIA users can use nvidia-smi and AMD users can use radeontop. The LibreHardwareMonitorLib NuGet package does target .NET Standard 2.0, but the library still depends on Windows-only driver calls internally.
- macOS: Use iStat Menus, Intel Power Gadget, or TG Pro
- Linux: Use lm-sensors, psensor (GUI), or s-tui (terminal-based)
- Cross-platform: Grafana with Prometheus node_exporter covers Linux/macOS monitoring with dashboards
Pro tip: If you need to monitor a Windows machine from a Mac or Linux device, enable Libre Hardware Monitor’s built-in web server (Options > Remote Web Server) and access it via your browser at http://[windows-ip]:8085.
Learn more about the web server feature in our features section.
Is Libre Hardware Monitor completely free?
Yes, Libre Hardware Monitor is completely free with no paid tiers, no premium features, and no license fees. Every feature in the application – temperature monitoring, fan speed tracking, voltage readouts, the web server, WMI provider, sensor logging, and system tray operation – is available at no cost.
The project is released under the Mozilla Public License 2.0 (MPL-2.0), which means the source code is freely available and anyone can modify, distribute, or use it in their own projects. Unlike HWMonitor (which has a free and a paid Pro version) or AIDA64 (which costs $39.95 for an Extreme license), Libre Hardware Monitor has no feature gates whatsoever. The development is funded entirely by volunteer contributions from over 260 developers on GitHub. There are no ads, no telemetry, no data collection, and no sign-up required.
- All monitoring features: free
- Built-in web server for remote access: free
- WMI provider for Rainmeter/script integration: free
- CSV sensor logging: free
- NuGet library for developers: free
Pro tip: If you find the software useful, consider starring the GitHub repository or contributing bug reports. Open-source projects rely on community feedback to improve.
Download it at no cost from our download section.
What is the difference between Libre Hardware Monitor and Open Hardware Monitor?
Libre Hardware Monitor is a fork of Open Hardware Monitor that continues active development. Open Hardware Monitor’s last meaningful update was around 2020, and its GitHub repository has been largely abandoned since then.
When Open Hardware Monitor stopped receiving updates, a group of contributors forked the project and created Libre Hardware Monitor to add support for modern hardware. As of v0.9.4 (November 2024), Libre Hardware Monitor supports Intel 14th Gen, AMD Ryzen 9000, NVIDIA RTX 40/50 series, and hundreds of new motherboard sensor definitions that Open Hardware Monitor cannot read. The Libre fork has also added features that never existed in the original: humidity sensor support, NZXT Kraken cooling device monitoring, Aqua Computer integration, dark theme, the NuGet developer library, and network interface monitoring.
- Open Hardware Monitor: last updated ~2020, missing modern CPU/GPU support, no new features
- Libre Hardware Monitor: actively maintained by 262+ contributors, supports all modern hardware, regular releases
- Both are open-source and free, but Open Hardware Monitor is effectively dead
- If you are currently using Open Hardware Monitor, switching to Libre is straightforward – just extract and run the new version
Pro tip: If you have scripts or Rainmeter skins that reference the Open Hardware Monitor WMI namespace, you will need to update them. Libre Hardware Monitor uses the namespace root\LibreHardwareMonitor instead of root\OpenHardwareMonitor.
See what hardware Libre Hardware Monitor supports in our features section.
How do I download and install Libre Hardware Monitor step by step?
Libre Hardware Monitor does not use a traditional installer. It is a portable application – you download a ZIP file, extract it, and run the executable directly. The entire process takes under two minutes.
The current version is v0.9.4, released November 24, 2024. The download file (LibreHardwareMonitor-net472.zip) is about 1.8 MB. It requires .NET Framework 4.7.2, which is already included in Windows 10 version 1803 and all versions of Windows 11. On older Windows versions (7, 8, 8.1), you may need to install .NET Framework 4.7.2 from Microsoft first.
- Go to our download section and click the download button, or visit the official GitHub Releases page
- Save the LibreHardwareMonitor-net472.zip file to your preferred location
- Right-click the ZIP > Extract All, and choose a permanent folder like C:\Tools\LibreHardwareMonitor\
- Open the extracted folder, right-click LibreHardwareMonitor.exe > Run as administrator
- If Windows SmartScreen pops up, click More info > Run anyway (this is normal for unsigned portable apps)
- The main window opens with a tree view of all detected hardware and sensor readings
Pro tip: Create a desktop shortcut to LibreHardwareMonitor.exe, then right-click it > Properties > Advanced > Run as administrator. This way it always launches with full sensor access without you needing to right-click each time.
For detailed setup and configuration, check our Getting Started guide.
Is Libre Hardware Monitor portable or does it need installation?
Libre Hardware Monitor is fully portable. There is no installer, no setup wizard, and no Windows registry entries (unless you enable the auto-start option). You extract the ZIP and run the .exe directly.
This makes it ideal for USB drives, IT technicians doing on-site diagnostics, or anyone who prefers not to install software permanently. The entire application folder is about 15 MB after extraction. Because it is portable, you can run it on machines where you do not have permission to install software – though you still need Administrator privileges for full sensor access. If you run it without admin rights, some sensors (particularly voltage and certain temperature readings that require the WinRing0 driver) will not appear.
- No installer needed – extract and run
- No registry entries created (unless you enable “Run on Windows Startup” in Options)
- No services installed in the background
- The WinRing0 driver loads temporarily while the program runs and unloads when you close it
- To “uninstall,” simply delete the folder
Pro tip: You can also install via WinGet if you prefer a package manager approach: open a terminal and run winget install LibreHardwareMonitor. This places it in your Program Files but still does not create a traditional installer entry.
Get the portable ZIP from our download section.
How do I make Libre Hardware Monitor start automatically with Windows?
Libre Hardware Monitor has a built-in option to run at Windows startup. Open the application, go to Options in the menu bar, and click “Run On Windows Startup.” That is all you need to do.
When you enable this setting, the program adds itself to the Windows startup registry key (HKCU\Software\Microsoft\Windows\CurrentVersion\Run). It will launch minimized to the system tray on your next reboot. For the startup to work with full sensor access, the shortcut needs to run with administrator privileges. If you find that sensors are missing after a reboot, it is likely because the program started without admin rights.
- Open Libre Hardware Monitor as Administrator
- Click Options > Run On Windows Startup (a checkmark appears)
- Optionally, click Options > Minimize To Tray so it stays out of the way
- To force admin startup: open Task Scheduler, create a new task that runs LibreHardwareMonitor.exe with “Run with highest privileges” checked, triggered at logon
Pro tip: Using Task Scheduler instead of the built-in startup option is the most reliable way to get admin-level access on boot. The built-in option runs at normal user level unless you configure a workaround through the task scheduler.
For the complete setup walkthrough, see our Getting Started guide.
Why is Libre Hardware Monitor not detecting my GPU temperature?
Missing GPU temperature readings are usually caused by a driver conflict between Libre Hardware Monitor and your GPU driver software. This is especially common after updating AMD Adrenalin drivers (versions 24.x have been reported to cause this on RX 7800 XT and similar cards).
Libre Hardware Monitor reads GPU data through manufacturer-specific APIs: NVAPI for NVIDIA, ADL/ADLX for AMD, and Intel’s GPU monitoring interfaces. If the GPU driver update changes or locks access to these APIs, the temperature sensor disappears from the tree view. NVIDIA GPUs generally have fewer issues because NVAPI is more stable across driver versions. AMD cards are more commonly affected, particularly with Adrenalin 24.2.1 and later builds. For Intel Arc GPUs, support was added in more recent builds of Libre Hardware Monitor.
- Make sure you are running v0.9.4 or a nightly build – older versions lack support for newer GPUs
- Run as Administrator – GPU sensors require elevated privileges on some systems
- Check if your GPU shows up at all in the tree view (expand the GPU section). If it does but temperature reads 0, it is a driver issue
- Try rolling back your GPU driver one version using DDU (Display Driver Uninstaller) and see if the reading returns
- For AMD users: close AMD Adrenalin software before opening Libre Hardware Monitor, as both programs compete for sensor access
Pro tip: If you have an AMD GPU and need reliable temperature readings alongside Adrenalin, try HWiNFO64 as a complementary tool – it uses a different driver approach that sometimes avoids the conflict.
Check supported hardware on our features page.
Why are some sensor readings showing 0 or missing entirely?
Zero or missing sensor values typically mean the program cannot access the hardware interface for that particular sensor. The three most common causes are: not running as Administrator, the WinRing0 driver being blocked by antivirus, or the specific hardware not being supported yet.
Libre Hardware Monitor relies on multiple access methods depending on the sensor type. CPU temperatures use MSR registers (require admin), motherboard sensors use the Super I/O chip via I/O ports (require WinRing0), and GPU data uses vendor APIs. If any of these access paths is blocked, the corresponding sensor shows 0 or simply does not appear. Motherboard sensor definitions are also hardware-specific – the program needs a matching definition for your exact motherboard model, and not all boards are covered yet. The v0.9.4 release added hundreds of new board definitions for ASUS, Gigabyte, ASRock, and MSI, so make sure you are on the latest version.
- Close the program and re-launch it by right-clicking > Run as administrator
- Check your antivirus exclusions – make sure LibreHardwareMonitor.sys is not quarantined
- Update to v0.9.4 or the latest nightly build from GitHub for the newest hardware definitions
- Look at Options > check that the relevant hardware category is enabled (CPU, GPU, Storage, etc.)
- If your motherboard model is not recognized, open a GitHub issue with your board model – the community adds new definitions regularly
Pro tip: After first launch as admin, wait 5-10 seconds for all sensors to populate. Some sensors (particularly S.M.A.R.T. data from NVMe drives) take a moment to initialize and may show 0 briefly before updating.
Our Getting Started guide covers initial configuration in detail.
Can anti-cheat software block Libre Hardware Monitor?
Yes, some anti-cheat systems can conflict with Libre Hardware Monitor. EasyAntiCheat (used in Dead by Daylight, Fortnite, Apex Legends) and Vanguard (used in Valorant) are known to flag or block the WinRing0 kernel driver that Libre Hardware Monitor loads.
Anti-cheat software scans for kernel-level drivers that could be used for cheating – things like memory readers, input injectors, or privilege escalation tools. WinRing0 operates at ring 0 (the kernel level) and provides direct hardware access, which fits the pattern these systems look for. In most cases, the game will simply refuse to launch while the WinRing0 driver is loaded, or it may force-close Libre Hardware Monitor. Vanguard is particularly aggressive because it runs a kernel-level anti-cheat driver at boot time that monitors other drivers.
- Close Libre Hardware Monitor completely before launching games with anti-cheat
- Verify the driver is unloaded: open an admin Command Prompt and run
sc query WinRing0_1_2_0– if it says STOPPED, you are clear - For Valorant/Vanguard: a system restart after closing Libre Hardware Monitor may be required since Vanguard loads at boot
- Alternative: use HWiNFO64 for monitoring during gaming sessions, as it does not use WinRing0
Pro tip: If you need hardware monitoring during gaming, MSI Afterburner’s in-game OSD (which uses RivaTuner) is generally the safest option as it is whitelisted by most anti-cheat systems.
For more details on what runs at the driver level, see our features overview.
How do I update Libre Hardware Monitor to the latest version?
Libre Hardware Monitor does not have a built-in auto-update feature. To update, you download the latest ZIP from GitHub and replace the old files. The current stable version is v0.9.4 (November 2024).
Because the application is portable, updating is straightforward – you just swap the old folder contents with the new ones. Your settings are stored in LibreHardwareMonitor.config in the same folder as the executable, and this file persists across updates as long as you extract the new version into the same directory. If you used WinGet to install, you can update with winget upgrade LibreHardwareMonitor from a terminal. Nightly builds (pre-release versions like v0.9.5-pre519) are available on GitHub Actions for users who want the absolute latest hardware support, but these can be unstable.
- Close Libre Hardware Monitor if it is running
- Download the latest LibreHardwareMonitor-net472.zip from the download section or GitHub Releases
- Extract the new ZIP into the same folder, overwriting the old files (or extract to a new folder if you want to keep the old version)
- Your LibreHardwareMonitor.config file keeps your previous settings
- Launch the updated version as Administrator
Pro tip: Watch the GitHub repository (click Watch > Releases only) to get email notifications when a new stable version drops. This way you never miss an update that adds support for your hardware.
Check what version you need on our download page.
What is new in the latest version of Libre Hardware Monitor (v0.9.4)?
Version 0.9.4 was released on November 24, 2024 and is the largest update in the project’s history, with contributions from 52 new developers. It added support for Intel Arrow Lake and Lunar Lake processors, AMD Ryzen 9000 series, and expanded motherboard sensor definitions.
The update also introduced humidity sensor monitoring, NZXT Kraken X cooling device support, Aqua Computer hardware integration, and a selectable network interface option for the built-in web server. GPU monitoring was improved with better NVIDIA RTX 40 series coverage and fixes for AMD Radeon RX 7000 series temperature readings. On the developer side, the NuGet library (LibreHardwareMonitorLib) now supports .NET 8, .NET 9, and .NET 10 targets alongside the existing .NET Framework 4.7.2 and .NET Standard 2.0 builds.
- New CPU support: Intel Arrow Lake, Lunar Lake, Meteor Lake; AMD Ryzen 9000 (Granite Ridge)
- New cooling devices: NZXT Kraken X series, Aqua Computer controllers
- New sensor type: humidity monitoring
- Web server improvement: selectable network interface binding
- Theme customization: light and dark mode options
- Hundreds of new motherboard definitions for ASUS, Gigabyte, ASRock, MSI
- Individual sensor request capability for more granular data access
Pro tip: If you are on an older version and your new hardware is not detected, updating to v0.9.4 should resolve it. The jump from v0.9.3 to v0.9.4 added more hardware definitions than any previous release.
Download v0.9.4 from our download section.
Libre Hardware Monitor vs HWiNFO – which is better for hardware monitoring?
Both are excellent, and the answer depends on what you need. HWiNFO has broader and more accurate sensor coverage. Libre Hardware Monitor is open-source, has a built-in web server for remote monitoring, and exposes data via WMI for integration with Rainmeter and Home Assistant.
HWiNFO64 is the go-to recommendation on r/overclocking because its sensor accuracy is unmatched – it reads more data points per component and updates sensor definitions faster than any competitor. It also supports shared memory for OSD overlays with RivaTuner Statistics Server. However, HWiNFO is closed-source freeware (not open source), and its full-featured version occasionally nags about registration after extended sessions. Libre Hardware Monitor reads fewer sensors overall but provides features HWiNFO does not: a built-in HTTP web server on port 8085 for remote monitoring, a WMI provider (root\LibreHardwareMonitor) that integrates with Rainmeter widgets, and a NuGet library for C# developers building custom monitoring tools.
- Sensor accuracy and coverage: HWiNFO wins (more sensors, faster updates for new hardware)
- Remote monitoring: Libre Hardware Monitor wins (built-in web server, Home Assistant integration)
- Scripting/integration: Libre Hardware Monitor wins (WMI provider, NuGet library)
- Open source: Libre Hardware Monitor wins (MPL-2.0 license, fully auditable)
- Resource usage: both are lightweight, under 40 MB RAM
Pro tip: Many power users run both. HWiNFO for the in-game OSD overlay (via RTSS), and Libre Hardware Monitor for Rainmeter desktop widgets and Home Assistant dashboards. They can run simultaneously without conflict.
Explore Libre Hardware Monitor’s full feature set in our features section.
Libre Hardware Monitor vs HWMonitor – which should I use?
Libre Hardware Monitor is the better choice in almost every way. HWMonitor (by CPUID) is simpler but lacks sensor logging in the free version, has no remote monitoring, no WMI integration, and its sensor accuracy has been publicly questioned by the overclocking community.
A widely shared post on r/overclocking titled “PSA: STOP USING HWMONITOR” highlights the problems: HWMonitor sometimes reports incorrect maximum temperatures, misidentifies sensor sources, and has not kept up with modern hardware as well as alternatives. Its Pro version ($24.48) adds logging and graphs, but Libre Hardware Monitor provides both of those features for free. HWMonitor’s one advantage is simplicity – it has fewer options and a cleaner UI for users who just want to glance at temperatures without configuring anything. But if you need logging, remote access, or accurate data for overclocking decisions, Libre Hardware Monitor is the clear pick.
- Sensor logging: Libre Hardware Monitor (free CSV export) vs HWMonitor (Pro only, paid)
- Remote access: Libre Hardware Monitor (built-in web server) vs HWMonitor (none)
- Accuracy: Libre Hardware Monitor is generally more reliable, especially for max/min tracking
- Price: both have free versions, but HWMonitor locks features behind Pro
- UI simplicity: HWMonitor is slightly simpler for a quick glance
Pro tip: If you are switching from HWMonitor to Libre Hardware Monitor, note that the tree view layout is similar. Libre Hardware Monitor just gives you more data and more options in the same familiar format.
Download Libre Hardware Monitor for free from our download section.
How do I use Libre Hardware Monitor with Rainmeter or Home Assistant?
Libre Hardware Monitor exposes all sensor data through two interfaces that external tools can read: a WMI provider (for Rainmeter and local scripts) and an HTTP web server (for Home Assistant and network-based tools).
For Rainmeter, Libre Hardware Monitor publishes sensor data to the WMI namespace root\LibreHardwareMonitor. Rainmeter skins that use the WMI plugin can query this namespace to display real-time CPU temperatures, GPU load, fan speeds, and other readings directly on your desktop. You need to have Libre Hardware Monitor running in the background for the WMI data to be available. For Home Assistant, the official integration is documented at home-assistant.io/integrations/libre_hardware_monitor/. Enable the web server in Libre Hardware Monitor (Options > Remote Web Server, default port 8085), then add the integration in Home Assistant pointing to http://[your-pc-ip]:8085.
- For Rainmeter: Launch Libre Hardware Monitor as admin > download a Rainmeter skin that supports LHM WMI > the skin reads from
root\LibreHardwareMonitorautomatically - For Home Assistant: In Libre Hardware Monitor, enable Options > Remote Web Server > note your PC’s local IP address > in Home Assistant, add the Libre Hardware Monitor integration with the URL http://[ip]:8085/data.json
- For custom scripts: Use PowerShell with
Get-WmiObject -Namespace root\LibreHardwareMonitor -Class Sensorto pull all sensor data programmatically
Pro tip: If you are migrating from Open Hardware Monitor, update your Rainmeter skins to use the new WMI namespace. Replace root\OpenHardwareMonitor with root\LibreHardwareMonitor in all skin .ini files.
Learn about all integration options in our features section.
How do I export and log sensor data to a CSV file?
Libre Hardware Monitor has built-in CSV logging that records all sensor readings at regular intervals. Go to Options > Log Sensors to start recording. The log file is saved in the same folder as the executable.
The CSV file contains timestamped rows with columns for every detected sensor – CPU temperatures per core, GPU temperature, fan RPMs, voltages, clock speeds, load percentages, and more. The default logging interval is one second, which produces roughly 5 MB of data per hour depending on how many sensors your system has. You can open the CSV directly in Excel, Google Sheets, or LibreOffice Calc for analysis. For longer monitoring sessions (overnight stress tests, thermal throttling investigations), the file can grow large, so monitor disk space if you leave logging running for days.
- Open Libre Hardware Monitor as Administrator
- Click Options > Log Sensors (a checkmark appears and logging starts immediately)
- The CSV file appears in the application folder as LibreHardwareMonitor.log.csv (or similar)
- To stop logging, uncheck Options > Log Sensors
- Open the file in a spreadsheet application to analyze trends, chart temperatures over time, or identify thermal throttling
Pro tip: For automated or long-term logging, combine the CSV export with a simple PowerShell script that rotates log files daily. You can also use the NuGet library (LibreHardwareMonitorLib) in a C# console app to build a custom logger with exactly the sensors and intervals you need.
For setup details, visit our Getting Started guide.
Still have questions? Check the official GitHub Discussions or download the latest version from our download section.